
The app market is very competitive and users’ expectations for a good experience and quality are high. For this reason, mobile observability has become an important pillar to ensure user satisfaction and the constant evolution of applications.
What is mobile observability?
Observability in mobile apps is the ability to visualize and analyze relevant data about the behavior of apps, in order to identify problems and opportunities for improvement in real time.
In general terms, we want to monitor the quality of the application and ensure that it is bug free. But if an incident does happen, we need to have tools that help us react quickly to identify problems accurately.
In this world of apps, a flaw can generate a lot of negative comments and ratings in the app stores. Therefore, it is important that any issues are fixed as soon as possible so that fewer users are affected.
But what should you look for to have good observability? One tip is to try to answer these questions:
- Is the application bug free? Is this monitored? Does your team receive real-time alerts about failures?
- When a fault is analyzed, is there enough information? Like device data, operating system, memory, CPU, version of the application that caused the error and also the details of the error (stack trace)?
- Is it possible to reproduce the user’s steps at the time of the failure? Does the observability tool record all interactions/actions the user took prior to the crash?
- Are all API calls with success and failure rates, response times monitored? Can your team accurately tell if the error happened on the front end or if it was a service?
- Is there monitoring of the app opening time, page loading time and the time consumed by API calls?
- Are performance indices such as the Apdex known and monitored?
Next, we’ll talk a little about the main items that make up a good observability tool within the context of mobile applications.
What a good mobile observability tool should have?
Crash monitoring
The high incidence of crashes is one of the main reasons why users give a bad review in stores or even uninstall apps (AppSamurai).
Of course, even after a long testing and debugging process, apps can still crash, and these failures will result in negative ratings. Users will be quick to abandon apps after they crash, so it’s important that crashes are addressed as soon as possible.
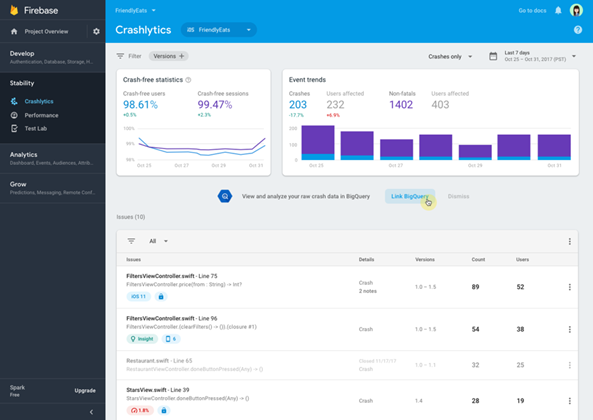
One of the best known metrics for these tools is crash-free users. It is recommended to always be below 1% and close to zero, that is, less than 1% of the user base with some impact on production.
A good observability tool can capture error details (stack trace), device and environment data, such as CPU data, memory, available storage space, battery level, internet connectivity status, number of users affected for failure etc.
This data collection is essential for the team to be able to reproduce the problem more easily and act quickly on corrections.
Next we have a Screenshot of the main console of one of the most famous and free tools, the Firebase Crashlytics of Google.
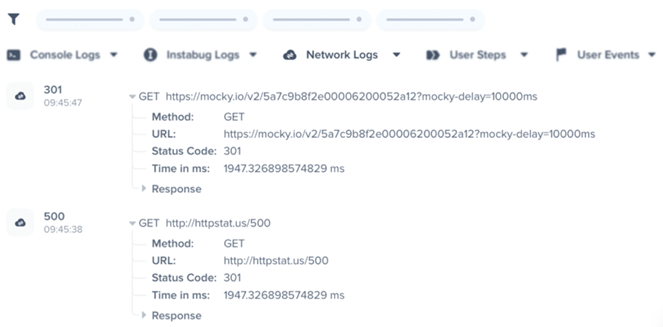
There are several other paid tools available in the market like Sentry, Instabug, Bugsnag, Datadog, New Relic, Dynatrace, among others, but which have some interesting features.
For example, some of them manage to capture much more information, such as, for example, the API calls that were made before a failure, to help the team in the diagnosis.
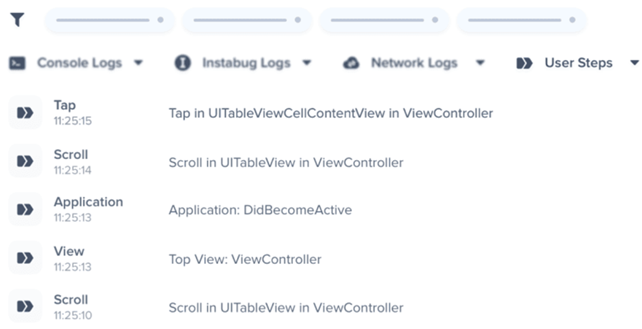
One of the most useful features is the recording of the user’s last steps until the moment of failure, so that we can accurately reproduce all user actions and interactions with the application.
Performance monitoring (APM)
According to Google, 53% of users abandon the app or website if it takes more than 3 seconds to load. Therefore, monitoring the application’s response time for page loading and for responding to user interactions is critical.
This is where APM (application performance monitoring) comes in, which is real-time monitoring of application performance. This practice consists of monitoring the loading time of all app screens, as well as API calls.
With good monitoring and an effective alert system, the team can be warned in real time if there are application screens or services that are taking longer than expected to load. This way, you can proactively anticipate problems.
To exemplify, imagine that the general rule of the application is that the pages load in up to 5 seconds, so if it takes longer, an alert can be triggered to investigate what is happening. Maybe it’s an app glitch, or even an API issue, but whatever the reason, this allows us to anticipate issues and not just react to them when we have a complaint from a user.
Another very common monitoring technique is tracing, which consists of logs that developers place in code to monitor certain parts of the application.
In conclusion, APM is particularly important in production environments, where an application’s performance can directly affect user satisfaction and the company’s bottom line. With constant monitoring, companies can identify and fix performance issues before they negatively impact the user experience.
Real-time alerts
So far, we’ve seen the two main characteristics of a good observability tool for mobile apps, which are crash monitoring and performance monitoring.
And for all of this to come to life, it’s important that everything is connected with a powerful real-time alert system.
For example: in case of a failure, it is important to send alerts to notify the team that errors are happening. These alerts can be sent based on custom rules, such as:
- Receive an alert if 2% of the user base is affected by a bug;
- Receive alerts about any new bug that occurs in the new version;
- Receive alerts if any repeat bugs appear, just to give a few examples.
The same applies for APM, where the idea is to receive alerts if the pre-stipulated performance metrics for the application are not being met.
With an effective real-time alert system, the team can react proactively to anticipate user complaints, that’s the goal.
Apdex (Application Performance Index)
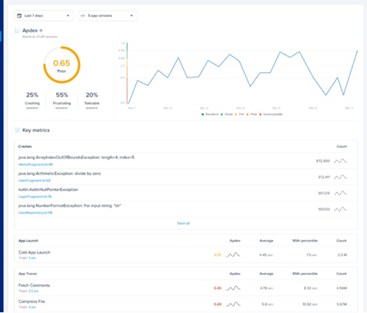
Finally, we arrive at one of the most important definitions in the world of observability for mobile applications, Apdex. There are some more formal definitions about Apdex, but explaining it in a simple way, it is a score composed of 0 (poor) to 1 (great) that summarizes in just one number how the user’s perception of your application is.
This is a very important metric to monitor user satisfaction over time, as it is a group of several indicators that evaluate:
- The application health;
- App load times and screens;
- Number of crashes;
- Performance of API calls etc.
Apdex can also be customized as needed. For example: there may be settings determining that some areas of the application need to have a maximum load time of 3 seconds. However, for others perhaps less important, 5 seconds is acceptable.
Conclusion
Observability is key to ensuring user satisfaction and the constant evolution of mobile applications.
As we saw in the article, a good observability tool should:
- Monitor application failures and performance;
- Collect relevant data;
- Send alerts in real time;
- Allow the reproduction of problems so that the team can act on corrections with agility.
In addition, it is important for the team to pay attention to the application’s quality and performance indices, such as the number of users, sessions, failures and response time, and to use the information obtained to make strategic decisions and carry out continuous improvements.
Investing in observability is investing in application quality and user satisfaction. This can be critical to a product’s success in the highly competitive mobile application market.
Ricardo Lecheta, mobile specialist and Chief Technology Officer at BRQ